Home

caphouse stores network packet captures in ClickHouse, making them queryable at the column level while preserving lossless PCAP reconstruction.
Read more and get started at the documentation site: https://cochaviz.com/caphouse/.
This project is still in an experimental state and should be used with caution! See the note on experimental state.
Use cases
- Network sensor capture and search — run
caphouse-monitoron a sensor to continuously ingest tcpdump ring buffers, then search across all captures using SQL filters or thecaphouse-uiweb interface. - Network telescope data storage — ingest high-volume unsolicited traffic
at scale;
ReplacingMergeTree-based deduplication makes re-ingest safe and--max-storagekeeps disk usage bounded. - Ad-hoc network analysis — load one or more PCAPs into a local ClickHouse instance and analyse them directly with SQL: inter-arrival times, flow statistics, protocol distributions, and anything else ClickHouse can express.
- Forensic analysis on large datasets — filter and export byte-exact PCAPs
across millions of packets without downloading unfiltered data; sanitize
captures before sharing with
caphouse-sanitize.
caphouse operates in two broad modes. For local analysis, use the caphouse
CLI to ingest PCAPs into a local ClickHouse, query them with -f, and export
filtered results. For hosted analysis, deploy caphouse-api behind
caphouse-ui for browser-based packet search, packet inspection, stream
overview, SQL exploration, GeoIP enrichment, and AI-assisted SQL generation.
Install
To install caphouse, you need Go (version 1.25 or above:
https://go.dev/doc/install) installed and have an active ClickHouse instance
(we recommend using the Docker image: https://clickhouse.com/docs/install).
Then, you run the following command:
go install github.com/cochaviz/caphouse@latest
go install github.com/cochaviz/caphouse/cmd/caphouse-api@latest
go install github.com/cochaviz/caphouse/cmd/caphouse-sanitize@latest
You can verify the installation by running:
Quick example
Option A — use your own ClickHouse
If you have a ClickHouse instance running (native protocol on localhost:9000),
point caphouse at it directly:
# DSN format: clickhouse://<user>:<password>@<host>:<port>/<database>
export DSN="clickhouse://default:default@localhost:9000/default"

# Ingest (prints the capture_id when done)
caphouse -d "$DSN" capture.pcap

# Ingest multiple files or a glob
caphouse -d "$DSN" ring*.pcap

# Keep caphouse-managed storage under 100 GiB
caphouse -d "$DSN" --max-storage 100GiB capture.pcap

# Export
caphouse -w -d "$DSN" -c "<capture_id>" out.pcap

# Filter and export
caphouse -w -d "$DSN" -c "<capture_id>" -f "ipv4.addr = '10.0.0.1' AND tcp.dst = 443" filtered.pcap
Option B — spin up a local test environment
No ClickHouse? The devcontainer stack bundles one. First, copy the env file:
Then bring up the stack:
The .env file sets COMPOSE_PROFILES=caphouse-ui by default, so this starts
clickhouse, dev, caphouse-api (with hot reload via air), and
caphouse-ui together. The UI is then available at http://localhost:8080 and
the API at http://localhost:8081.
To start only the core services (without the API and UI), remove or unset
COMPOSE_PROFILES in .devcontainer/.env.
Load test data
The repository ships sample captures under testdata/ tracked with
Git LFS. Retrieve them with:
git-lfs is pre-installed in the devcontainer dev image. For Option A,
install it from https://git-lfs.com first.
Once the files are available, ingest them:
Option A — from your local shell:
Option B — open a shell in the dev container and run:
More usage examples can be found in the documentation.
caphouse-ui
caphouse-ui is the browser frontend for caphouse-api. It is meant for the
hosted side of caphouse, where you can explore captures without dropping to the
CLI for every query.
It currently gives you:
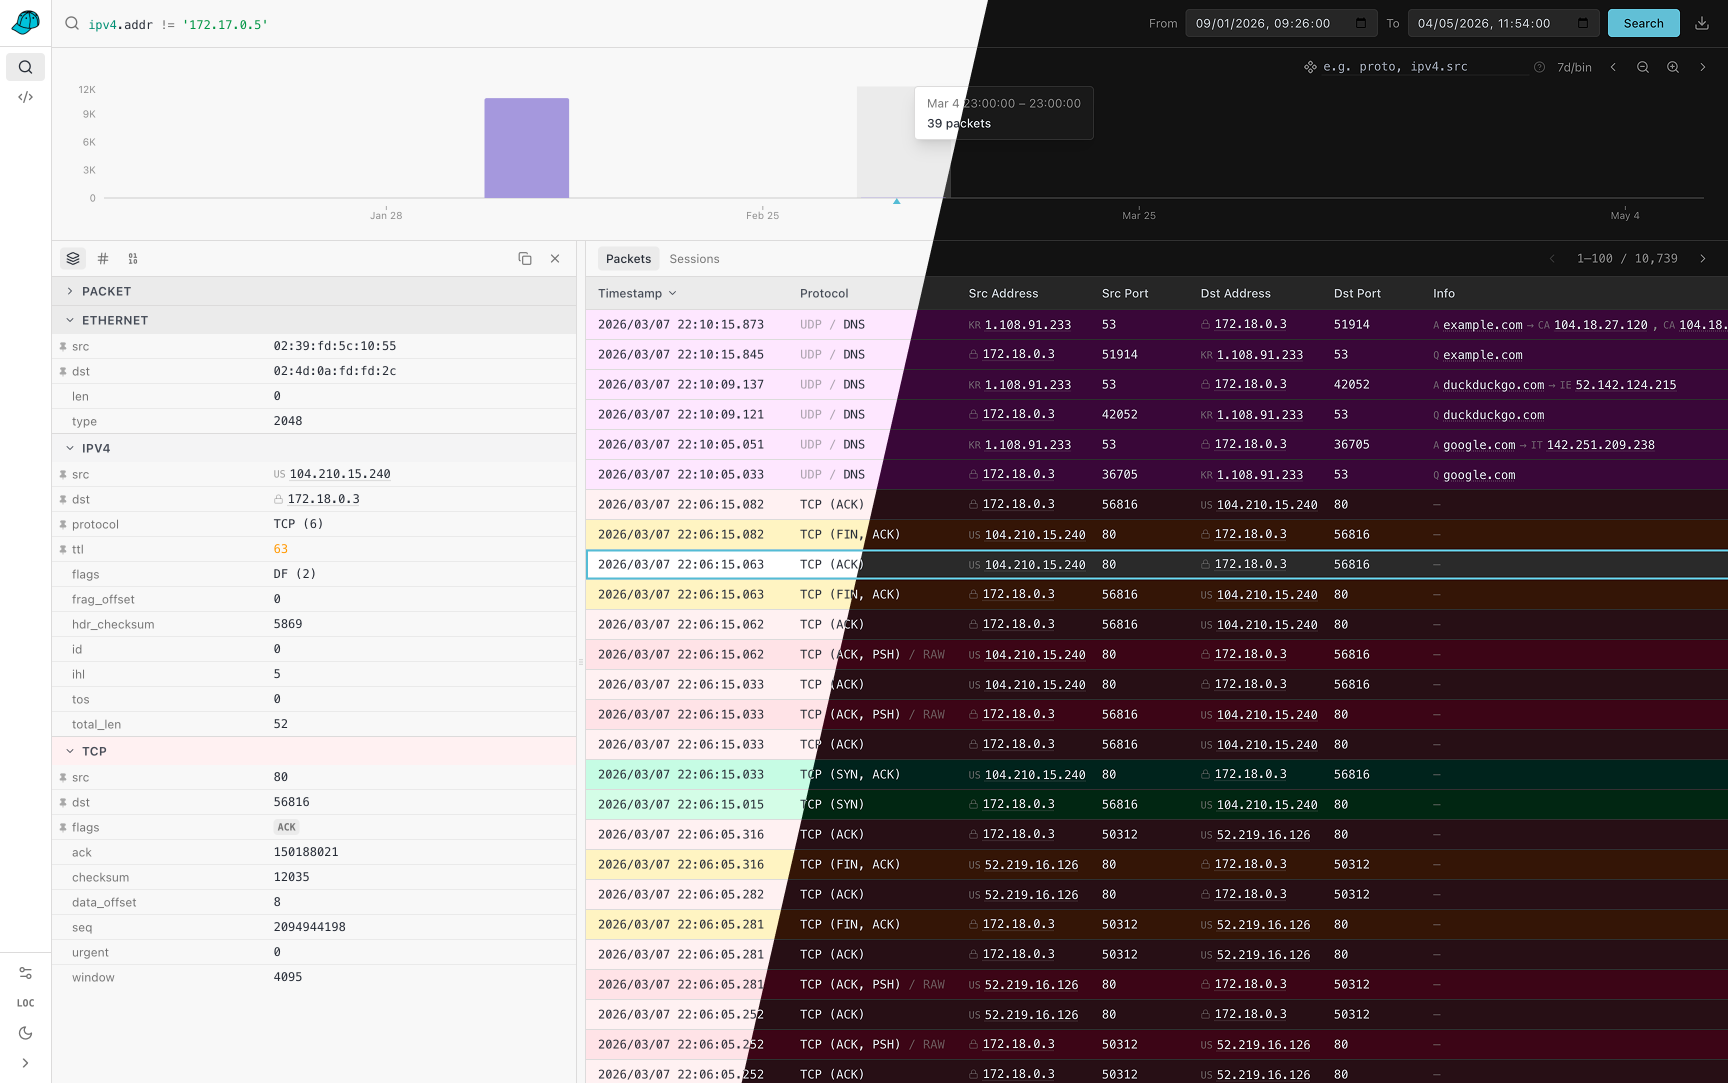
- A packet search workspace with the same filter model used by
caphouse -f, interactive time ranges, histogram zooming, histogram breakdowns, and one-click PCAP export. - A packet detail drawer with structured per-layer fields, copy helpers, raw bytes, hex dumps, and quick filter pivots from packet values back into the search bar.
- A sessions view for higher-level stream inspection, including L7 summaries such as HTTP, TLS, and SSH where stream tracking is enabled.
- A query workbench with schema browsing, SQL preview/build/execute flows,
saved queries, history, and AI-assisted SQL generation when
ANTHROPIC_API_KEYis configured oncaphouse-api. - An admin page for re-encoding older under-parsed packets after new protocol components are added.
To use the UI, run caphouse-api against your ClickHouse database and serve
caphouse-ui so that /v1, /docs, and /openapi.json resolve to the API.
The repo ships the UI in caphouse-ui/ and the API in
cmd/caphouse-api/. In the repository dev environment,
the UI is available on port 8080.
Deployment
The repository ships two container images:
Dockerfilebuilds the backend image withcaphouseandcaphouse-api. The runtime image defaults tocaphouse-api.caphouse-ui/Dockerfilebuilds the frontend as a static site and serves it with nginx.
Development stack
The devcontainer compose file (.devcontainer/docker-compose.yml)
includes a bundled ClickHouse service. See Quick example — Option B
above for the exact commands.
When working inside a devcontainer-capable editor (VS Code, JetBrains), open
the repo in the devcontainer: the dev container starts automatically with
CAPHOUSE_DSN pre-set and air available for hot-reloading the API.
Production images
For production, the repository-level docker-compose.yml
builds caphouse-api and caphouse-ui, but intentionally does not start a
ClickHouse container. Production deployments are expected to point at an
existing ClickHouse instance via CAPHOUSE_DSN.
That means the simplest production flow is:
- Provision ClickHouse separately.
- Build and run the backend from
DockerfilewithCAPHOUSE_DSNset to that ClickHouse instance. - Build and run the frontend from
caphouse-ui/Dockerfile. - Put both behind your preferred reverse proxy so the UI and API share an
origin and
/v1,/docs, and/openapi.jsonreachcaphouse-api.
The top-level compose file is a good starting point for steps 2 and 3, but you will usually add your own port mappings, TLS, and reverse-proxy configuration around it.
Filters and Querying
For querying stored captures, you can use the standalone -f/--filter flag to
generate a SQL query and pipe it to clickhouse-client:
Use --capture all with a time-range filter to query or export across every
capture at once:
# Export all captures within a time window, merged and sorted by time
caphouse -w -d "..." -c all \
  --from 2024-01-01T00:00:00Z --to 2024-01-01T01:00:00Z merged.pcap

# Generate SQL spanning all captures
caphouse -d "..." -c all \
  --from 2024-01-01T00:00:00Z --to 2024-01-01T01:00:00Z \
  -f "ipv4.addr = '10.0.0.1'" | clickhouse-client
For more details on filters and querying, see the documentation.
Streaming
By default, caphouse uses stdin for input and stdout for output, meaning
you can pipe PCAP data directly to caphouse with tcpdump:
Because of caphouse's retry mechanism, you can use tcpdump's ring buffers
for at-least-once delivery. A companion script, caphouse-monitor, can be used
for this exact purpose. First, install it using the following command:
This will install caphouse-monitor to $HOME/.local/bin, allowing you to
continuously capture network traffic without losing packets if ClickHouse is
temporarily unavailable:
Note on Experimental State
This project is in an experimental state. I personally use it for backing up network captures in the context of research, and we have some testing deployments for network sensors. Your mileage may vary depending on the application.
Beyond maturity, there are various features (either functional or non-functional) that are missing before we can consider a pre-release stage:
- Thorough test coverage: Most of the tests are happy-path, with some covering explicit design decisions to avoid accidental regession. We need more thorough coverage in various e2e scenarios to validate reliability.
- High-throughput ingest/export: Now we're limited with ingest up to 10MB/s, and similar export speed.
- Clustered deployments: A single web interface couples to exactly one ClickHouse instance. This might be problematic when working with a cluster of network sensors.
- Least privilege: An ingest account needs full creation/insertion/deletion privileges. Depending on the deployment, this might or might not be problematic. (Web needs read-only.)